For me, the first hint of the coming west coast weirdness was while forecasting in Baja this past winter season. For several decades the winds on Baja’s East Cape have become less reliable, and gustier and the massive all-day/all-night El Norte winds were rarer. But this winter we had a great season but the source of the winds was often different. Baja’s East Cape has always had mild winter local sea breezes in the mid to maybe upper-teens range. But the big El Norte winds occurred when these mild local winds combined with strong winds from the USA’s 4 corners region.
And, those El Norte winds have become less reliable. But this season much of the northerly wind came from a huge North Pacific High was atypically near Baja’s west coast. At the time I passed all this off as just a quirk in the wind patterns.
Generally, as the winter season passes the average position of the North Pacific High moves north into Southern California and then Central California coastal waters and they see a period of frequent strong NW ocean wind. Then the NPH moves closer to the San Francisco Bay Area and NW ocean winds ramp up there and weaken in Southern California and Baja waters. And finally, in summer, the NPH moves west of the Pacific Northwest and lingers helping to provide the powerful winds of the Columbia River Gorge while June Gloom sets in for San Francisco. But this summer has been surprisingly different.
This year NW coast winds continued to blow for much of May and June for Baja, Southern California, the Central California coast and the Bay Area. While the Gorge mostly had cool showery weather and mild winds.
What happened? This graphic shows the entire pacific from the USA to Japan. It looks at the current
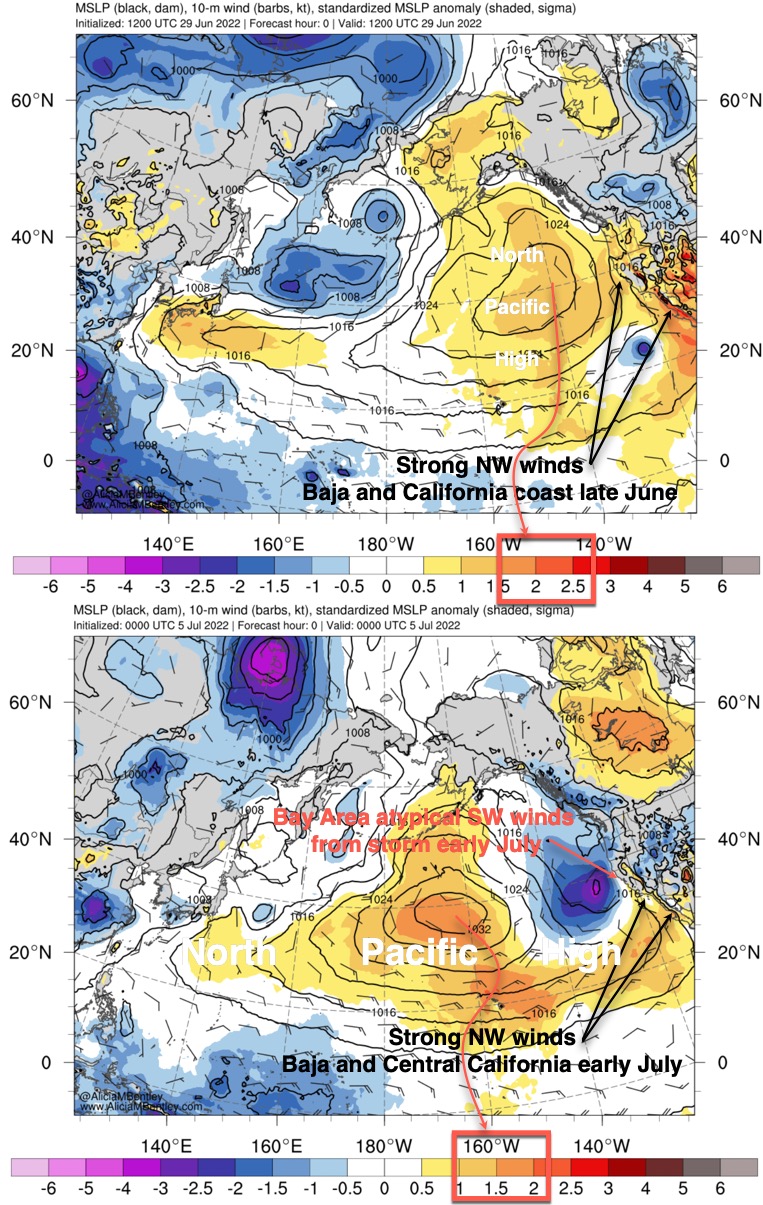
weather events compared to the climatology from 1979-2010 and indicates how much each point on the map deviates from the norm ie. how anomalous is the weather at tha point.
In this top image for June 29 first, locate the isobars of the North Pacific High and your part of the west coast. Notice the large size of the NPH and its strong winds near Baja and California. The yellow to orange color represents the anomaly of the NPH from the historical averages in Standard Deviations. If you are
not familiar with S.D. just think that 2 on the lower scale means that a portion of the NPH with that color deviates 95% from the average NPH ie. the NPH in that region is pretty weird compared to the average for that place and date.
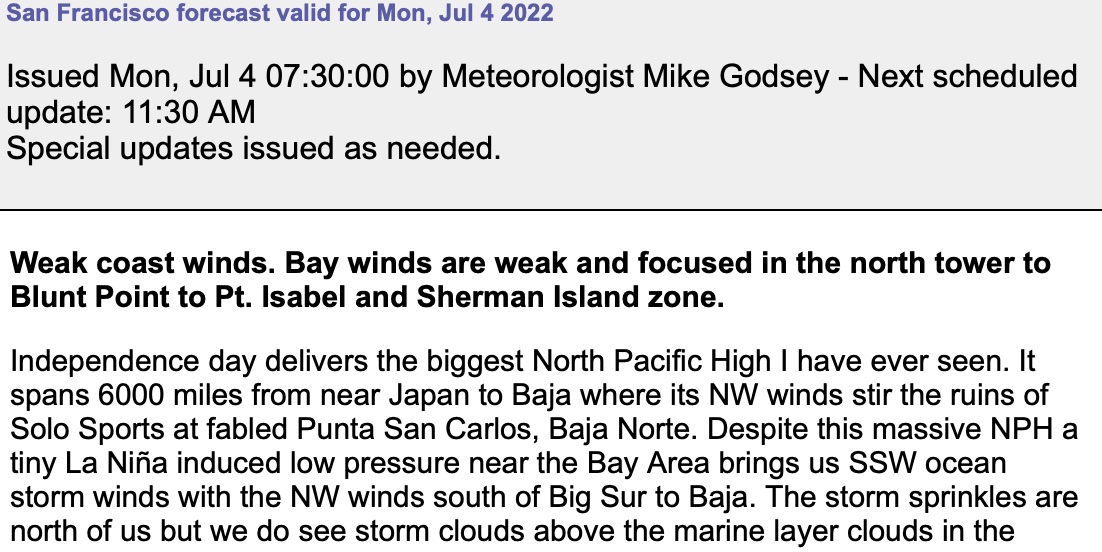
Now check out my forecast for July 4 and notice my mention of a huge 6000 mile wide NPH stretching from near Japan to Baja.
Now low at the second image above for July 5. In that image, you can see the isobars of this huge North Pacific High. Once again notice the great anomaly in the NPH mid pacific and near Southern California and Baja plus the continued strong NW winds. Now note the anomalous storm near Northern California to the Pacific Northwest which is creating weak southerly storm winds in July.
Any one of the days this summer is just a low probability anomaly but having so many in a few months is a serious anomaly. To use a poker example. Getting dealt a royal flush is just a low probability event. But getting dealt many royal flushes in an evening would make you begin to think that something is messing with the deck of cards.
The causation of all this anomaly is complex and beyond the scope of this blog. But as Bob Dylan once said… “The Times They Are A-Changin'”