Sure it was Sept. 2 which is around when the San Francisco, Southern California and Gorge winds BEGIN to fade but we rarely see zero to faint winds for the entire West Coast this early in the fall. Take a look at these forecasts!
Reading the forecasts you notice 2 things in common. They all mention weak winds but they also all mention upper level low-pressure. But when you look at the surface winds and isobars all you see is a massive North Pacific High spanning the waters from near Japan to near the USA’s west coast.
And you see a tiny low-pressure area off the Northern California coast that seems to be blocking the mighty N-NW winds of that huge North Pacific High.

But often a smaller weather feature, like this low-pressure, is created by a far larger weather way aloft. It is hard for most people to grasp how winds miles aloft can impact the wind that hits their wing/kite/sail.
So, in this blog, I will try to show how what appears like a tiny weather feature at the surface is actually part of a major weather factor far aloft.
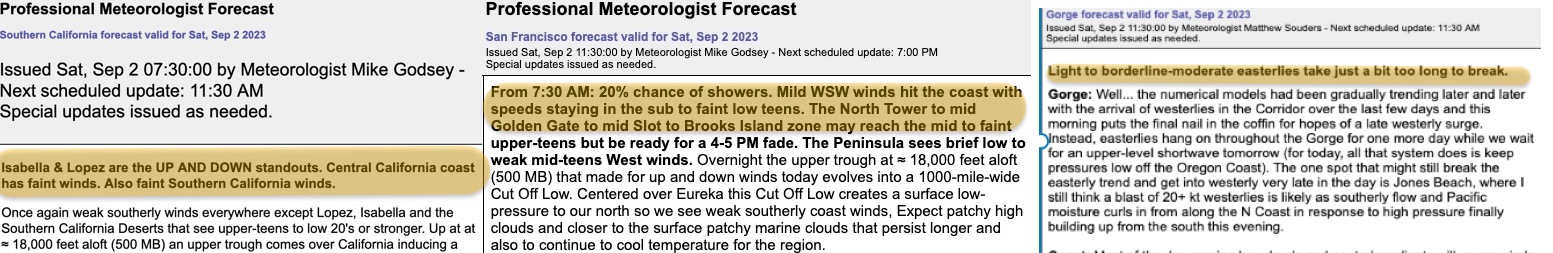
For the Gorge that tiny low-pressure and its monster friend aloft blocked the North Pacific High that is critical for creating The Gorge’s westerly pressure gradient killing and weakening the wind for several days.
For the Bay Area and Southern California, the tiny low and its friends pushed the North Pacific High’s surface NW winds far away from shore. Meanwhile, the Cut Off Low created low pressure over the coast, spoiling the pressure gradient to the Central Valley.
I decided to do all this in a novel way!

So, my San Francisco forecast for Sept. 2 stepped out of our normal forecast prose and started like this…
Today’s Assignment:
1. Go to any page that shows the Surface isobars over the eastern Pacific.
2. Notice the huge North Pacific High extending from near Japan and over Hawaii to about 200 miles from your house.
3. Now check out the tiny 100-mile-wide low-pressure centered just off Pt. Arena blocking the NW ocean winds.
4. Ponder how such a tiny critter could block such a massive beast.
5. Now go to a page that shows the eastern Pacific but at the 500 MB. level.
6. Sort of scary, huh? That Cut Off Low is only 1000 miles wide but its 40-70 mph winds are centered right over Pt. Arena to San Francisco creating and reinforcing that tiny surface low.
7. That Cut Off Low departs Monday. So why am I forecasting NW clearing winds for that day?
This last animation shows what the clouds from the Cut-Off Low looked like over the western USA.
The reason for this long-winded list is to help customers understand why variables aloft are important in forecasting.
When amateurs try to forecast they tend to focus almost entirely on near-surface variables like our pressure gradient data, our sensors, their window and hopefully analyze satellite imagery.
( I say hopefully since last month in one of our regions an amateur forecast nuking winds while we were forecasting light up and down winds. Turns out they did not check the satellite imagery to notice the rain clouds moving fast toward the region. So only weak, wet winds arrived. Oops!)
Forecasting using our data and your window works great when there are big winds but not so well for subtle winds which are more common on the west coast nowadays.
And with wing foiling those lighter winds are really important. And to understand and forecast milder winds you really have to look at variables aloft.
Insiders’ tip: We actually give these amateurs in each region a free Weatherflow account each year when they request it. That way these amateurs have access to all our information free in doing their forecasts, which helps our customers!