The news is full of dire warnings of a “Heat Dome” over the western USA. You may know that that a heat dome traps hot air in like a lid, causing scorching temperatures. If, not you surely know that a heat dome spells misery.
But exactly who does all this happen? And are “Heat Domes” becoming more common? And, if you are a wind worried wind sports addict, just skip to #11!
Let’s look at the major steps creating a Heat Dome these uncomfortable and even dangerous conditions.
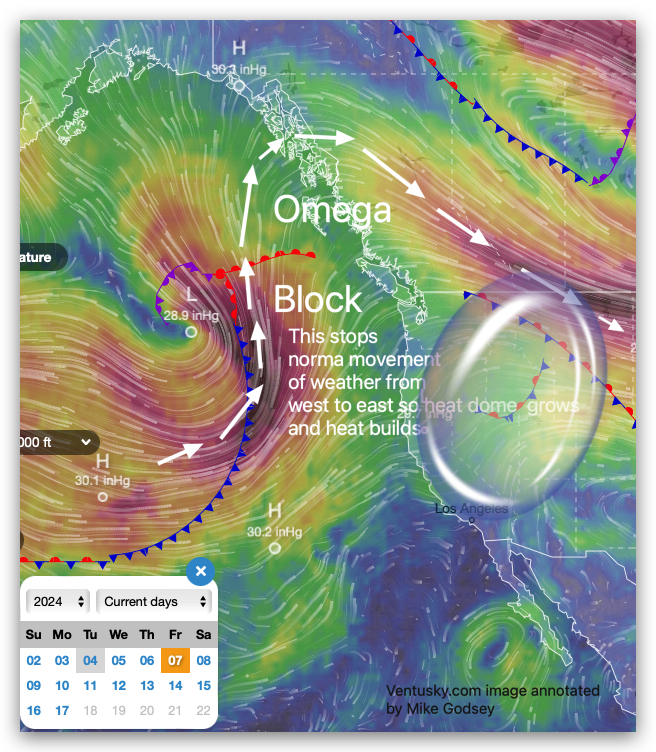
1, The process starts an upper high-pressure ridge moves over western USA so warmer air moves northward. You can see this happening in the animation above.
2, This upper ridge may evolve into an Omega Block shape that slows the normal movement of weather from west to east and traps the warmer air. You can see this Omega Block in the next image.
3, Descending air in the high-pressure ridge compresses as it nears the surface further heating the surface air and creating a “Heat Dome”
4, Descending air in the Heat Dome also traps warm air trying to rise from the surface so temperatures continue to increase.
5. The same descending air pushes natural dust particles and human made polluntants towards the surface so the air become brown and stagnant.
5, As the air compresses it dries out and humidity levels drops.
6, Lower humidity and high temperatures dries out plants and the soil the so we lose the cooling effect of evaporation and the heat wave becomes worse. As water leaves plants the percentage of oils and resins in leaves and twigs goes up making them more flammable.
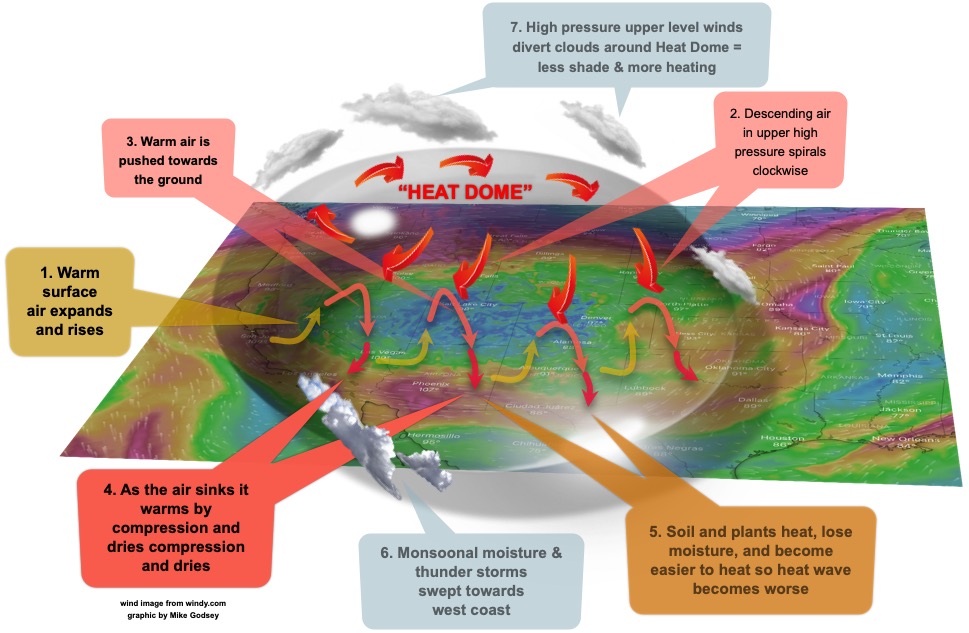
7, As the air continues to descend it spirals outward in a clockwise fashion around the Heat Bubble evaporating clouds or diverting them away from the dome so there is less cooling shade or chance of rain.
8, All this increases the risk of wild fires.
9, This process can continue for days or weeks until the Omega Block breaks down and westerly upper level winds destroy the heat dome.
10, Meanwhile, the winds spiraling out from the southern and western flank of the heat dome can sweep moist tropical from the Gulf of Mexico and the Sea of Cortez towards the west coast. These “Monsoonal” conditions bring unstable air and rising clouds resulting in thunderstorms, lightening and wildfires as the heat wave ends.
11, West Coast wind sports are driven by having the North Pacific High off the coast of California and low-pressure inland. With a heat dome over the western USA surface low-pressure expands over west coast. This weakens the winds the San Francisco Bay Area, the Southern California coast and the Columbia River Gorge. But as the heat wave ends very strong winds SOMETIMES arrive!
The elephant in the room is the question: “are “Heat Domes” becoming more common and who is to blame”
It is impossible to determine the role of Climate change in any individual heat dome. But we can look at Climate models and historical data to look for trends.
Scientists estimate that a heat dome like the major 2021 event is now far more likely compared to pre-industrial times.
All the climates models available internationally suggest that a warming earth will produce an increased frequency of “Heat Bubble”.
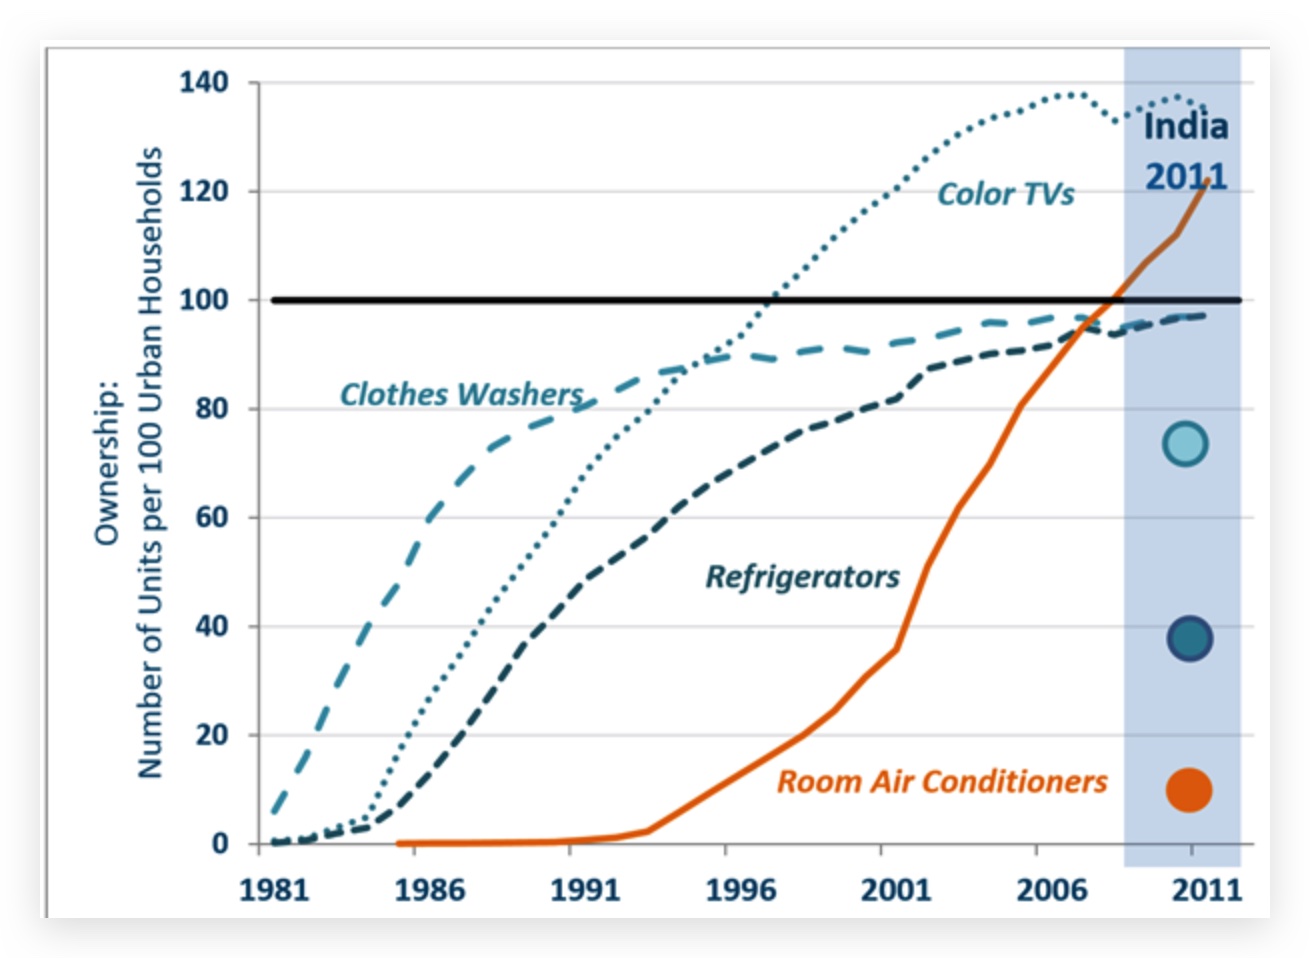
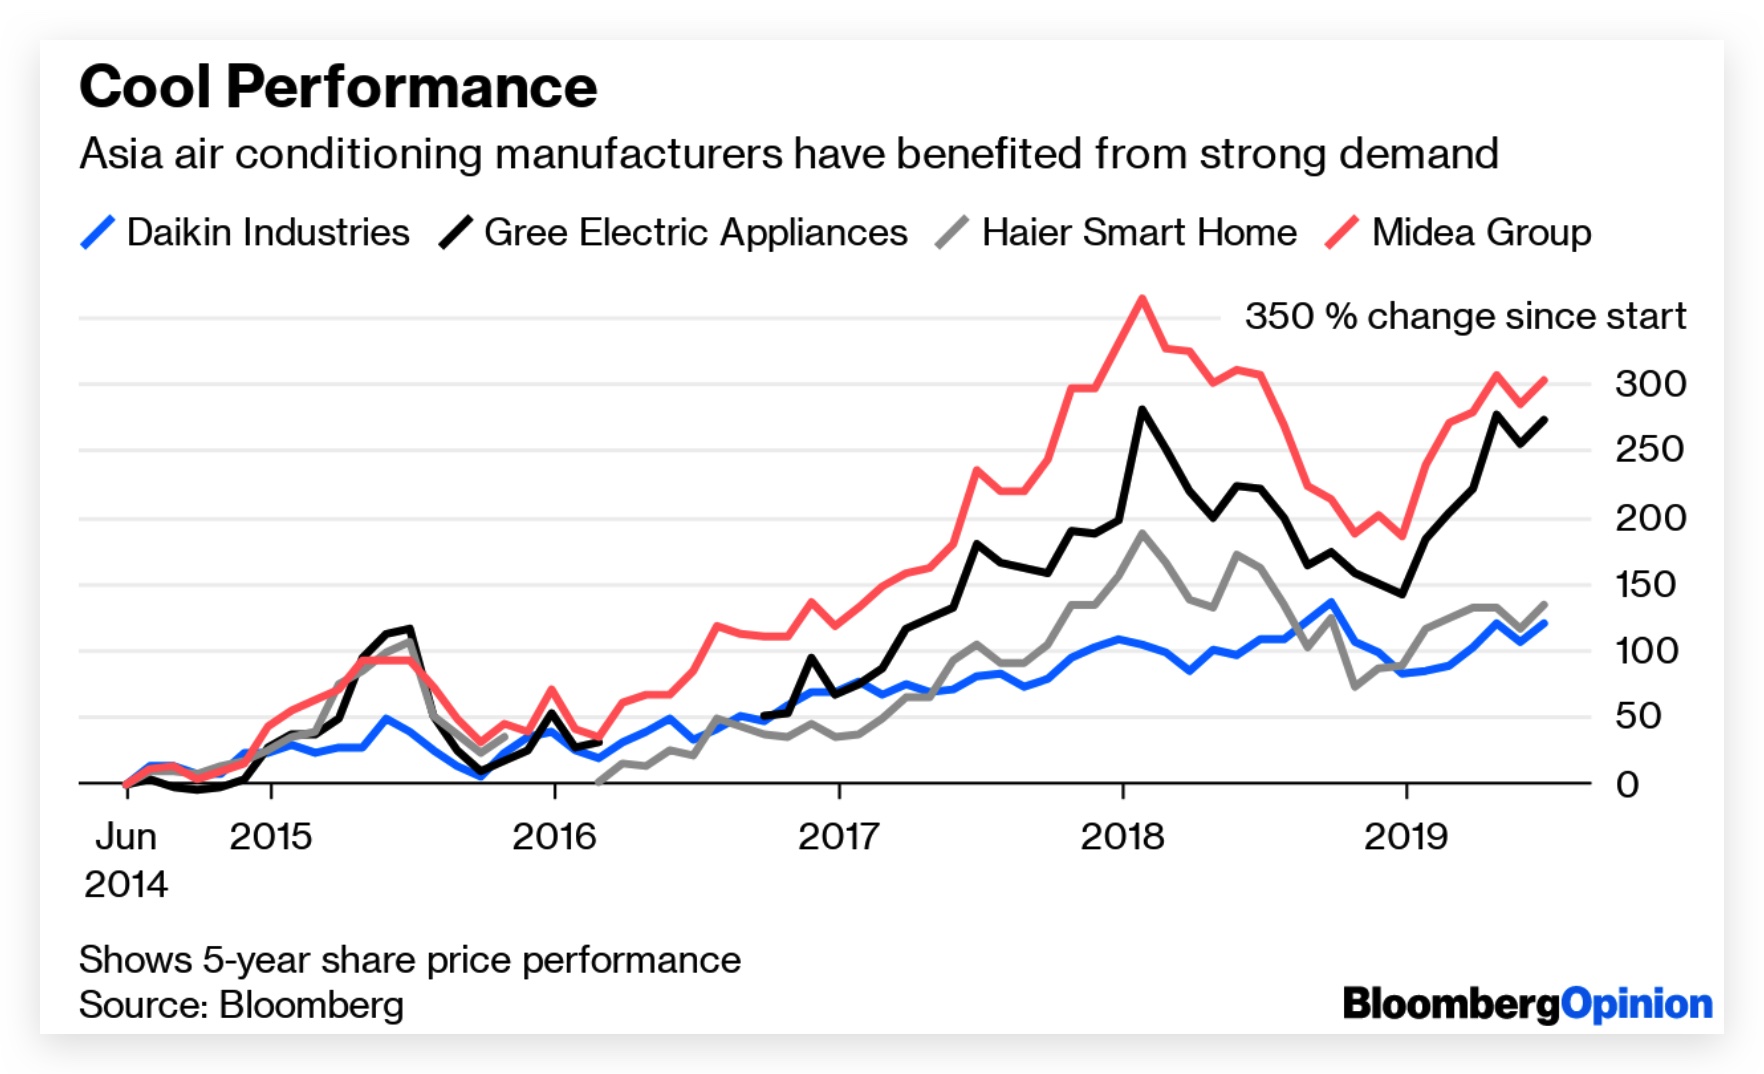
But if you don’t trust scientists then look at the sale rates of Air Conditioners world wide. Some of the people buying all those AC units probably don’t believe in global warming but their sweat does!
Here are some references regarding this issue as cited by: https://www.nature.com/articles/s41467-023-37309-y
- Oudin Åström, D., Forsberg, B., Ebi, K. L. & Rocklöv, J. Attributing mortality from extreme temperatures to climate change in Stockholm, Sweden. Nat. Clim. Change 3, 1050–1054 (2013).Article ADS Google Scholar
- Mora, C. et al. Global risk of deadly heat. Nat. Clim. Change 7, 501–506 (2017).Article ADS Google Scholar
- IPCC, 2021: Summary for Policymakers. In: Climate Change 2021: The Physical Science Basis. Contribution of Working Group I to the Sixth Assessment Report of the Intergovernmental Panel on Climate Change [Masson-Delmotte, V., et al. (eds.)]. Cambridge University Press, Cambridge, United Kingdom and New York, NY, USA, pp. 3−32, https://doi.org/10.1017/9781009157896.00.
- Lewis, S. C. & Karoly, D. J. Anthropogenic contributions to Australia’s record summer temperatures of 2013. Geophys. Res. Lett. 40, 3705–3709 (2013).Article ADS Google Scholar
- Imada, Y. et al. The contribution of anthropogenic forcing to the Japanese heat waves of 2013. Bull. Am. Meteorol.Soc. 95, S52–S54 (2014).Google Scholar
- Ma, S., Zhou, T., Stone, D. A., Angélil, O. & Shiogama, H. Attribution of the July–August 2013 heat event in Central and Eastern China to anthropogenic greenhouse gas emissions. Environ. Res. Lett. 12, 054020 (2017).
- Sánchez-Benítez, A., García-Herrera, R., Barriopedro, D., Sousa, P. M. & Trigo, R. M. June 2017: the earliest european summer mega-heatwave of reanalysis period. Geophys. Res. Lett. 45, 1955–1962 (2018).Article ADS Google Scholar
- Imada, Y., Watanabe, M., Kawase, H., Shiogama, H. & Arai, M. The July 2018 high temperature event in japan could not have happened without human-induced global warming. Sola 15A, 8–12 (2019).Article ADS Google Scholar
- Ren, L. et al. Anthropogenic influences on the persistent night-time heat wave in summer 2018 over Northeast China. Bull. Am. Meteorol. Soc. 101, S83–S88 (2020).Article Google Scholar
- Philip, S. Y. et al. Rapid attribution analysis of the extraordinary heatwave on the Pacific Coast of the US and Canada June 2021. Earth Syst. Dyn. Discuss. 13, 1689–1713 (2022).Article ADS Google Scholar
- Thompson, V. et al. The 2021 western North America heat wave among the most extreme events ever recorded globally. Sci. Adv. 8, eabm6860 (2022).Article PubMed PubMed Central Google Scholar
- Benfield, A. Global catastrophe recap september 2021 (PDF). (Report). p. 13. Retrieved from http://thoughtleadership.aon.com/Documents/20210012-analytics-if-september-global-recap.PDF (2021).
- Lin, H., Mo, R. & Vitart, F. The 2021 western North American heatwave and its subseasonal predictions. Geophys. Res. Lett. 49, e2021GL097036 (2022).Article ADS Google Scholar
- World Meteorological Organization (WMO) 2021. State of the Global Climate WMO Provisional report. Available online at https://library.wmo.int/doc_num.php?explnum_id=10859 (2021).
- Teng, H., Branstator, G., Wang, H., Meehl, G. A. & Washington, W. M. Probability of US heat waves affected by a subseasonal planetary wave pattern. Nat. Geosci. 6, 1056–1061 (2013).Article ADS CAS Google Scholar
- Adams, R. E., Lee, C. C., Smith, E. T. & Sheridan, S. C. The relationship between atmospheric circulation patterns and extreme temperature events in North America. Int. J. Climatol. 41, 92–103 (2021).Article Google Scholar
- Grotjahn, R. et al. North American extreme temperature events and related large scale meteorological patterns: a review of statistical methods, dynamics, modeling, and trends. Clim. Dyn. 46, 1151–1184 (2016).Article Google Scholar
- Sousa, P. M., Trigo, R. M., Barriopedro, D., Soares, P. M. M. & Santos, J. A. European temperature responses to blocking and ridge regional patterns. Clim. Dyn. 50, 457–477 (2018).Article Google Scholar
- Yiou, P. AnaWEGE: a weather generator based on analogues of atmospheric circulation. Geoscientific Model Dev. 7, 531–543 (2014).Article ADS Google Scholar
- Jézéquel, A., Yiou, P. & Radanovics, S. Role of circulation in European heatwaves using flow analogues. Clim. Dyn. 50, 1145–1159 (2018).Article Google Scholar
- Jézéquel, A., Yiou, P., Radanovics, S. & Vautard, R. Analysis of the exceptionally warm December 2015 in France using flow analogues. Bull. Am. Meteorol. Soc. 99, S76–S79 (2018).Article ADS Google Scholar
- Ren, L., Zhou, T. & Zhang, W. Attribution of the record-breaking heat event over Northeast Asia in summer 2018: the role of circulation. Environ. Res. Lett. 15, 054018 (2020).Article ADS Google Scholar
- Ye, Y. & Qian, C. Conditional attribution of climate change and atmospheric circulation contributing to the record-breaking precipitation and temperature event of summer 2020 in southern China. Environ. Res. Lett. 16, 044058 (2021).Article ADS Google Scholar
- Horton, D. E. et al. Contribution of changes in atmospheric circulation patterns to extreme temperature trends. Nature 522, 465–469 (2015).Article ADS CAS PubMed Google Scholar
- Vautard, R. et al. Attribution of human-induced dynamical and thermodynamical contributions in extreme weather events. Environ. Res. Lett. 11, 114009 (2016).Article ADS Google Scholar
- NOAA. What is a heat dome? National Ocean Service website, https://oceanservice.noaa.gov/facts/heat-dome.html (2021).
- Bartusek, S., Kornhuber, K. & Ting, M. 2021 North American heatwave amplified by climate change-driven nonlinear interactions. Nat. Clim. Change 12, 1143–1150 (2022).Article ADS Google Scholar
- Beck, C., Philipp, A. & Jacobeit, J. Interannual drought index variations in Central Europe related to the large-scale atmospheric circulation—application and evaluation of statistical downscaling approaches based on circulation type classifications. Theor. Appl Climatol. 121, 713–732 (2015).Article ADS Google Scholar
- Chardon, J. et al. Spatial similarity and transferability of analog dates for precipitation downscaling over France. J. Clim. 27, 5056–5074 (2014).Article ADS Google Scholar
- Radanovics, S., Vidal, J.-P., Sauquet, E., Ben Daoud, A. & Bontron, G. Optimising predictor domains for spatially coherent precipitation downscaling. Hydrol. Earth Syst. Sci. 17, 4189–4208 (2013).Article ADS Google Scholar
- Kay, J. E. et al. The community earth system model (cesm) large ensemble project: a community resource for studying climate change in the presence of internal climate variability. Bull. Am. Meteorol. Soc. 96, 1333–1349 (2015).Article ADS Google Scholar
- Douville, H., Colin, J., Krug, E., Cattiaux, J. & Thao, S. Midlatitude daily summer temperatures reshaped by soil moisture under climate change. Geophys. Res. Lett. 43, 812–818 (2016).Article ADS Google Scholar
- Seneviratne, S. I. et al. Impact of soil moisture‐climate feedbacks on CMIP5 projections: first results from the GLACE‐CMIP5 experiment. Geophys. Res. Lett. 40, 5212–5217 (2013).Article ADS Google Scholar
- Vogel, M. M. et al. Regional amplification of projected changes in extreme temperatures strongly controlled by soil moisture‐temperature feedbacks. Geophys. Res. Lett. 44, 1511–1519 (2017).Article ADS Google Scholar
- Wehrli, K., Guillod, B. P., Hauser, M., Leclair, M. & Seneviratne, S. I. Identifying key driving processes of major recent heat waves. J. Geophys. Res. Atmos. 124, 11746–11765 (2019).Article ADS Google Scholar
- Fischer, E., Seneviratne, S., Vidale, P. L., Luthi, D. & Schar, C. Soil moisture–atmosphere interactions during the 2003 european summer heat wave. J. Clim. 20, https://doi.org/10.1175/JCLI4288.1 (2007).
- Jones, B., Tebaldi, C., O’Neill, B. C., Oleson, K. & Gao, J. Avoiding population exposure to heat-related extremes: demographic change vs climate change. Clim. Change 146, 423–437 (2018).Article ADS Google Scholar
- Qian, C., Ye, Y., Chen, Y. & Zhai, P. An updated review of event attribution approaches. J. Meteorol. Res. 36, 227–238 (2022).Article Google Scholar
- Meehl, G. et al. Climate change projections in CESM1(CAM5) compared to CCSM4. J. Clim. 26, https://doi.org/10.1175/JCLI-D-12-00572.1 (2013).
- Hausfather, Z., Marvel, K., Schmidt, G. A., Nielsen-Gammon, J. W. & Zelinka, M. Climate simulations: recognize the ‘hot model’ problem. Nature 605, 26–29 (2022).Article ADS CAS PubMed Google Scholar
- Karl, T. R. et al. U.S. temperature and drought: recent anomalies and trends. Eos, Trans. Am. Geophys. Union 93, 473–474 (2012).Article ADS Google Scholar
- Teuling, A. J. et al. Evapotranspiration amplifies European summer drought. Geophys. Res. Lett. 40, 2071–2075 (2013).Article ADS Google Scholar
- Miralles, D. G., Gentine, P., Seneviratne, S. I. & Teuling, A. J. Land–atmospheric feedbacks during droughts and heatwaves: state of the science and current challenges. Ann. N. Y. Acad. Sci. 1436, 19–35 (2019).Article ADS PubMed Google Scholar
- Selten, F., Bintanja, R., Vautard, R. & Hurk, B. Future continental summer warming constrained by the present-day seasonal cycle of surface hydrology. Sci. Rep. 10, 4721 (2020).Article ADS CAS PubMed PubMed Central Google Scholar
- Horowitz, R., McKinnon, K. & Simpson, I. Circulation and soil moisture contributions to United States heatwaves. J. Clim. 35, 4431–4448 (2022).Article ADS Google Scholar
- Vogel, M. M., Zscheischler, J. & Seneviratne, S. I. Varying soil moisture–atmosphere feedbacks explain divergent temperature extremes and precipitation projections in central Europe. Earth Syst. Dyn. 9, 1107–1125 (2018).Article ADS Google Scholar
- Seneviratne, S. I. et al. Investigating soil moisture–climate interactions in a changing climate: a review. Earth-Sci. Rev. 99, 125–161 (2010).Article ADS CAS Google Scholar
- Fischer, E. M. & Knutti, R. Anthropogenic contribution to global occurrence of heavy-precipitation and high-temperature extremes. Nat. Clim. Change 5, 560–564 (2015).Article ADS Google Scholar
- Barnes, E. A., Dunn-Sigouin, E., Masato, G. & Woollings, T. Exploring recent trends in Northern Hemisphere blocking. Geophys. Res. Lett. 41, 638–644 (2014).Article ADS Google Scholar
- Horton, R. M., Mankin, J. S., Lesk, C., Coffel, E. & Raymond, C. A review of recent advances in research on extreme heat events. Curr. Clim. Change Rep. 2, 242–259 (2016).Article Google Scholar
- Alexander, L. V. et al. Global observed changes in daily climate extremes of temperature and precipitation. J. Geophys. Res. Atmos. 111, https://doi.org/10.1029/2005JD006290(2006).
- Hersbach, H. et al. The ERA5 global reanalysis. Q. J. R. Meteorol. Soc. 146, 1999–2049 (2020).Article ADS Google Scholar
- Otto-Bliesner, B. L. et al. Climate variability and change since 850 ce: an ensemble approach with the community earth system model. Bull. Am. Meteorol. Soc. 97, 735–754 (2016).Article ADS Google Scholar
- Jones, B. & O’Neill, B. C. Spatially explicit global population scenarios consistent with the shared socioeconomic pathways. Environ. Res. Lett. 11, 084003 (2016).Article ADS Google Scholar
- Jones, B. & O’Neill, B. C. Global population projection grids based on shared socioeconomic pathways (SSPs), 2010–2100 (2017).
- Wang, J. et al. Anthropogenically-driven increases in the risks of summertime compound hot extremes. Nat. Commun. 11, 528 (2020).Article ADS CAS PubMed PubMed Central Google Scholar
- Fischer, E. M., Sippel, S. & Knutti, R. Increasing probability of record-shattering climate extremes. Nat. Clim. Change 11, 689–695 (2021).Article ADS Google Scholar
- Hempel, S., Frieler, K., Warszawski, L., Schewe, J. & Piontek, F. A trend-preserving bias correction – the ISI-MIP approach. Earth Syst. Dyn. 4, 219–236 (2013).Article ADS Google Scholar
- Nangombe, S. S., Zhou, T., Zhang, W., Zou, L. & Li, D. High‐temperature extreme events over africa under 1.5 and 2 °C of global warming. J. Geophys. Res. Atmos. 124, 4413–4428 (2019).Article ADS Google Scholar
- Stone, D. A. & Allen, M. R. The end-to-end attribution problem: from emissions to impacts. Clim. Change 71, 303–318 (2005).Article ADS Google Scholar
- Zhang, W., Zhou, T., Zou, L., Zhang, L. & Chen, X. Reduced exposure to extreme precipitation from 0.5 °C less warming in global land monsoon regions. Nat. Commun. 9, 3153 (2018).Article ADS PubMed PubMed Central Google Scholar
- Zhang, W. & Zhou, T. Increasing impacts from extreme precipitation on population over China with global warming. Sci. Bull. 65, 243–252 (2020).Article Google Scholar
- Zhang, W. & Zhou, T. The effect of modeling strategies on assessments of differential warming impacts of 0.5 °C. Earth’s Future 9, e2020EF001640 (2021).Article ADS Google Scholar
- Li, D., Zhou, T., Zou, L., Zhang, W. & Zhang, L. Extreme high-temperature events over east Asia in 1.5 °C and 2 °C warmer futures: analysis of ncar cesm low-warming experiments. Geophys. Res. Lett. 45, 1541–1550 (2018).Article ADS Google Scholar
- Download references
- Acknowledgements
- This study is supported by the National Natural Science Foundation of China under Grant No. 41988101. We thank the National Oceanic and Atmospheric Administration for providing the Global Historical Climatology Network Daily database (GHCN-D): https://www.ncei.noaa.gov/products/land-based-station/global-historical-climatology-network-daily/, and the European Center for Medium-Range Weather Forecasts for providing the ERA5 reanalysis data: https://cds.climate.copernicus.eu/cdsapp#!/search?type=dataset. We also appreciate the National Center for Atmospheric Research for producing and making available their model (CESM1) output (https://www.earthsystemgrid.org/dataset/ucar.cgd.ccsm4.output.html/).
- Author information
- Authors and Affiliations
- State Key Laboratory of Numerical Modeling for Atmospheric Sciences and Geophysical Fluid Dynamics (LASG), Institute of Atmospheric Physics, Chinese Academy of Sciences, Beijing, 100029, ChinaXing Zhang, Tianjun Zhou, Wenxia Zhang, Jie Jiang, Shuai Hu, Meng Zuo, Lixia Zhang & Wenmin Man
- University of Chinese Academy of Sciences, Beijing, 100049, ChinaXing Zhang & Tianjun Zhou
- China Meteorological Administration, Beijing, 100081, ChinaLiwen Ren
- Contributions
- T.Z. designed the research and contributed to the interpretation and presentation of the results. X.Z. performed the analysis, drafted the manuscript, and contributed to the interpretation of the results. W.Z. contributed to the interpretation and presentation of the results. L.R. helped the study of methods and contributed to the interpretation and presentation of the results. J.J., S.H., M.Z., L.Z., and W.M. helped to organize and revise the draft.
- Corresponding author
- Correspondence to Tianjun Zhou.
- Ethics declarations
- Competing interests
- The authors declare no competing interests.
- Peer review
- Peer review information
- Nature Communications thanks the anonymous reviewers for their contribution to the peer review of this work.
- Additional information
- Publisher’s note Springer Nature remains neutral with regard to jurisdictional claims in published maps and institutional affiliations.
- Supplementary information
- Supplementary Information
- Rights and permissions
- Open Access This article is licensed under a Creative Commons Attribution 4.0 International License, which permits use, sharing, adaptation, distribution and reproduction in any medium or format, as long as you give appropriate credit to the original author(s) and the source, provide a link to the Creative Commons license, and indicate if changes were made. The images or other third party material in this article are included in the article’s Creative Commons license, unless indicated otherwise in a credit line to the material. If material is not included in the article’s Creative Commons license and your intended use is not permitted by statutory regulation or exceeds the permitted use, you will need to obtain permission directly from the copyright holder. To view a copy of this license, visit http://creativecommons.org/licenses/by/4.0/.
- Reprints and permissions
- About this article
- Cite this article
- Zhang, X., Zhou, T., Zhang, W. et al. Increased impact of heat domes on 2021-like heat extremes in North America under global warming. Nat Commun 14, 1690 (2023). https://doi.org/10.1038/s41467-023-37309-y
- Download citation
- Received16 June 2022
- Accepted09 March 2023
- Published27 March 2023
- DOIhttps://doi.org/10.1038/s41467-023-37309-y
- Share this article
- Anyone you share the following link with will be able to read this content:Get shareable link
- Provided by the Springer Nature SharedIt content-sharing initiative
- Subjects
- Climate change
- Climate-change impacts
- This article is cited by
- Warming-induced hydrothermal anomaly over the Earth’s three Poles amplifies concurrent extremes in 2022
- Jie Zhang
- Haishan Chen
- Rui Hu
- The dry-hot feedback between soil moisture and atmosphere and the accelerated global warming
- Tianjun Zhou
- Record-breaking Barents Sea ice loss favors to the unprecedented summertime extreme heatwave in 2021 over western North America by enhancing Rossby wave ridge
- Yuying Wei
- Fei Huang
- Zheng Chen
- Beach day or deadly heatwave? Content analysis of media images from the 2021 Heat Dome in Canada
- Emily J. Tetzlaff
- Nicholas Goulet
- Glen P. Kenny
- Projected increase in summer heat-dome-like stationary waves over Northwestern North America
- Ziming Chen
- Jian Lu
- L. Ruby Leung
- Comments
- By submitting a comment you agree to abide by our Terms and Community Guidelines. If you find something abusive or that does not comply with our terms or guidelines please flag it as inappropriate.
- Download PDF