Watch the ebb or flow of ephemeral fog at the Golden Gate or the rapid movements of puffball cumulus clouds during a summer day, and you quickly realize that forecasting cloud coverage is often a crap shoot. Clouds form and evaporate with random
temperature changes, elevation changes, relative humidity, vertical movement, aerosols. Etc.
But supercomputer models can consume all that information and sometimes make useful cloud forecasts.
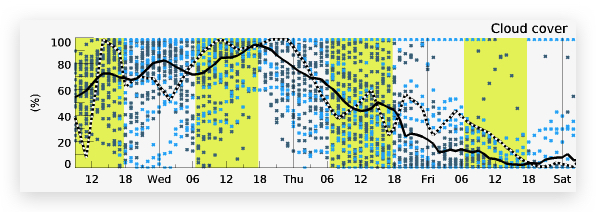
For example, take a look at this graphic for yesterday. Each of the data points shows the % cloud overage a particular model suggested for each hour during the day. The black line shows the average cloud coverage of this Multimodel Ensemble Forecast. When I issued my forecast yesterday, that line was at about 50% cloud coverage of the general area.
50% cloud coverage over the Coastal Valleys is simply not enough to allow for the warming we needed to stir low-teens local sea breezes much less create a gradient strong enough to curve the El Norte winds outside to our beaches.
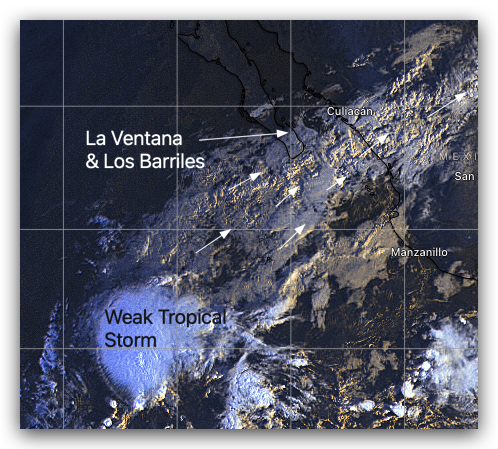
But Weatherflow also runs a super high-resolution cloud model over Baja’s East Cape. This model also showed about 50% coverage but it also showed a hole opening in the clouds due to heating.
I gambled that that hole would last long enough to allow some up and down mid to upper-teens winds for La Ventana. As this satellite animation shows… I was lost.