But often fail at the exact focus of it’s winds.
by Mike Godsey, MikeAT iwindsurf.com
Years ago when I first began forecasting when the models could barely resolve the entire Bay Area I and the NWS were oblivious of eddies off the Golden Gate. Sure ocean fishing party boats knew that sometime there were mysterious SW winds near the coast while northerly wind blew out at the ocean buoys. But know one was looking at how these eddies impacted Bay Area winds.
 So these days we are pretty good at forecasting when an eddy is likely to spring up and produce SW winds inside the Bay. But we are still pretty poor at forecasting the exact sites where the southerly wind will focus other than saying the wind focus will be mostly N. of the Bay Bridge. Why is that so hard? Well…..
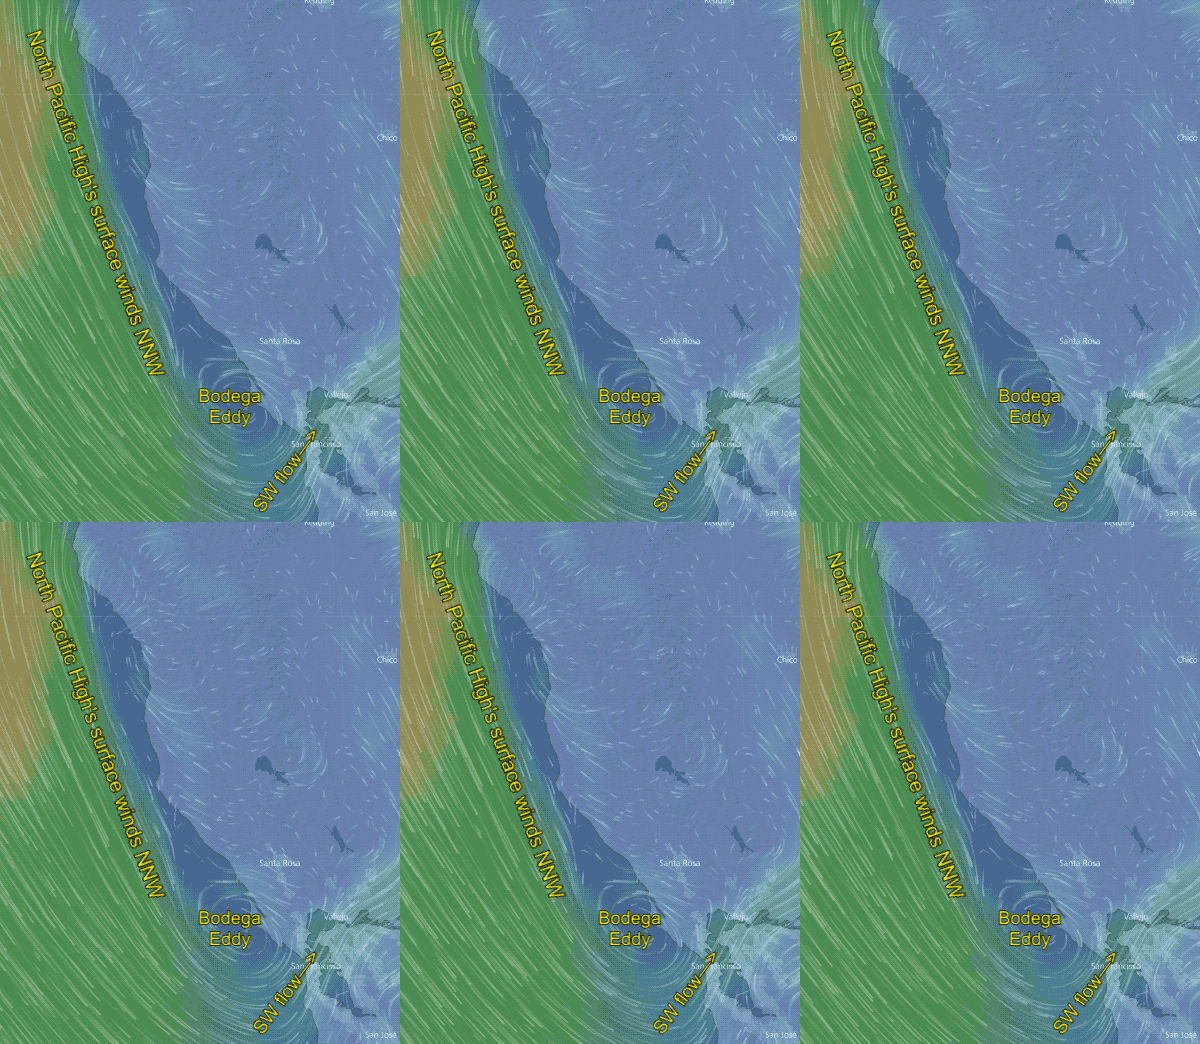
First let’s look at the big picture. Way out in the pacific is the center of the North Pacific High and the winds spiraling clockwise from the high pressure.
But today, in response to upper level winds, the NPH has a extension or ridge leaning into the Pacific Northwest.
Why should bay kiters and windsurfer care about events off the Pacific Northwest? Because when the North Pacific High forms a ridge it’s NW coastal winds turn more NNW. Which means:
- Given the angle of the California coast it becomes harder for the ocean wind to curve into the Bay Area.
- And if conditions are right (or wrong if you sail the coast or most of the Peninsula) this NNW wind helps a counter-clockwise spinning eddy form west of the Bay Area like you see in this second animation.
In this second animation the wind focus looks easy to forecast. The SW flow should be strongest at Pt. Isabel, Berkeley and Sherman Island with weaker winds at Larkspur and Brickyards/Peacock Gap.
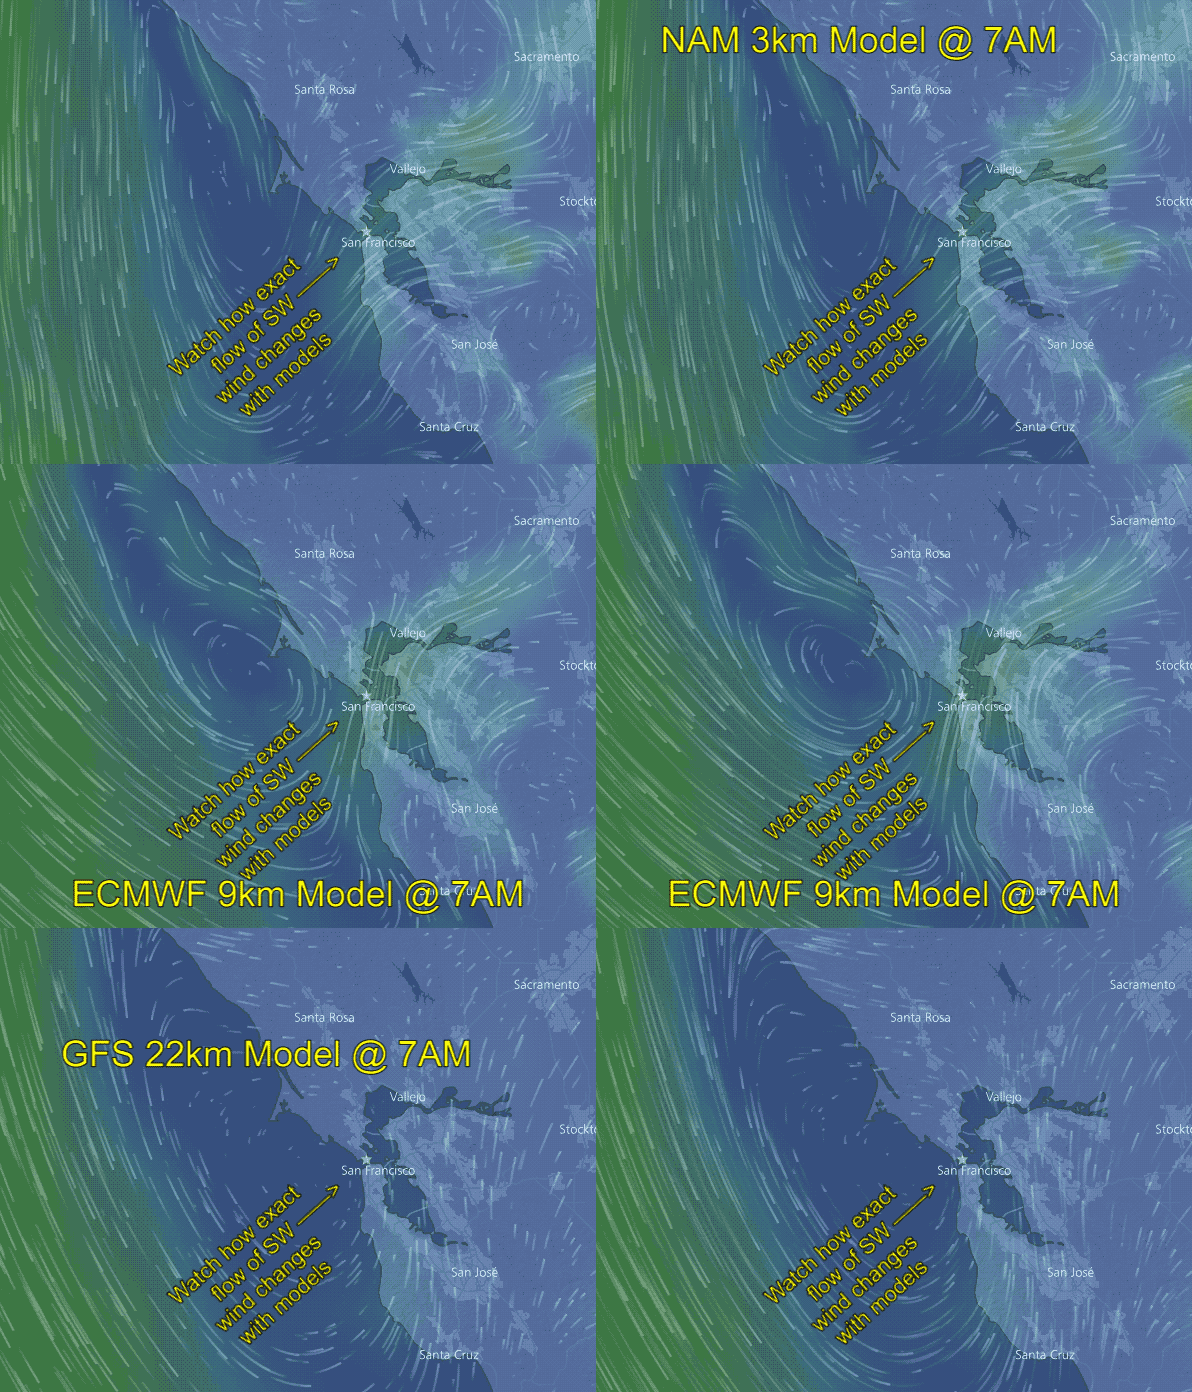
The problem is that this animation is just what one model suggests about the eddies location and shape.  We typically look at about 5 models each day to get a rough handle on what the wind is likely to do that day. But when it comes to eddies the models can differ wildly.
This last animation show how today’s eddy (August 16, 2017) is modeled by the NAM3, ECMWF and GFS models. Notice that all 3 models depict an eddy off the Bay Area. But notice how differently they are in the shape and location of the eddy and the focus of the SW wind.
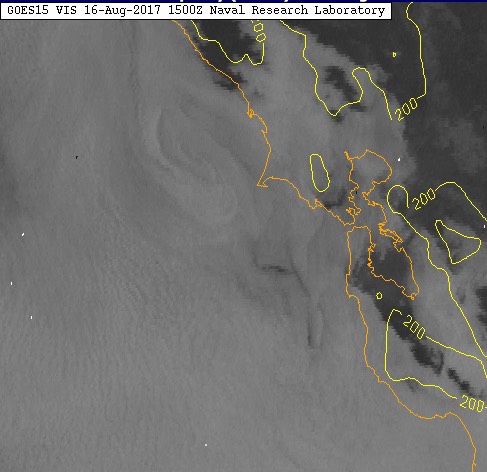
So how do we make a forecast from this mess? We look at the empirical data like the satellite imagery and the reports from all the ocean buoys and coastal sensors and see which model most closely reflects the reality.
From there we look at the focus of the pressure gradients to different parts of the Central Valley versus all the gaps in the coast range to see how the wind is likely to be funneled towards different sites.
So far so good! But the eddy often changes location and shape during the day. Which means blown forecasts.
Now you take a try at it. Here is the satellite imagery from about 8AM this morning. See the eddy just west of Pt. Reyes? Now which model from the animation above would you start your forecast from?


