Mysterious E/ENE undercut in spite of solid W/SW’rlys around Duxbury 5/9
Tim Kent
5/16/16
A day like many other spring days with Low pressure spinning well to the North of the region scheduled rotate a short wave through the region late morning or early afternoon. High pressure set up in the Great Lakes, producing solid W’rly gradient over the New England region.
See forecast below:
As you can see I was anticipating the W’rly flow to back SW’rly and couple with Sea Breeze influences as the shortwave approached, a classic Canal Trough feature (a la Matt Corey) was likely to develop as full sun encouraged strong surface heating. Therefore, I bumped up tables beyond guidance in the early afternoon to reflect what I suspected would be a pretty solid afternoon of SW’rly flow. See Tables Below:
See AM guidance vs Observations for Duxbury:
As you can see AM guidance does not suggest a NE/ENE’rly turn with the exception of the hourly updating HRRR which doesnt count since it incorporates hourly observations into each new run and it still doesnt suggest that the turn happens until hours later anyway.
So what happened??? lets take a look at some urface analysis maps just to confirm the scenario.
The 12z Analysis from WPC shows exactly what we have described prior.
SPC’s surface objective analysis at 11AM does reveal more pronounced trough like feature at the surface right along the Mass. coast. Not unusual in and of itself especially considering the Upper Level shortwave that was in the area and the general pattern in place.
But why were pressures so low over just W of Duxbury as to induce a reversal within a solid W/SW’rly gradient????
See Wind Map:
So lets look into this further…..
Surface METARS for Mass.
Taunton
STN     TIME PMSL   ALTM   TMP DEW RH  DIR SPD GUS PEAK  VIS  CLOUDS                  Weather      MIN MAX P01  PCP
     DD/HHMM hPa    inHg   F   F   %   deg kt  kt  ddfff mile                                      F   F   in   in
==== ======= ====== ====== === === === === === === ===== ==== ======= ======= ======= ============ === === ==== ====
TAN  09/1552 1013.5  29.93  66  36  33 260   9  17       10.0  SCT065
TAN  09/1452 1013.8  29.94  64  36  35 260  14  20       10.0  FEW060  FEW090
TAN  09/1352 1014.0  29.94  61  37  41 250   9  19       10.0  CLR
TAN  09/1252 1014.4  29.96  57  37  47 240   7           10.0  SCT100
TAN  09/1152 1014.3  29.95  51  35  54 230   4           10.0  SCT070  OVC090                       46  51
TAN  09/1052 1013.8  29.94  51  34  52 240   3           10.0  BKN065  OVC090
Marshfield (Duxbury)
STN     TIME ALTM   TMP DEW RH  DIR SPD GUS VIS  CLOUDS                  Weather      P01
     DD/HHMM inHg   F   F   %   deg kt  kt  mile                                      in
==== ======= ====== === === === === === === ==== ======= ======= ======= ============ ====
GHG  09/1555  29.93  52  41  66  60   9     10.0  FEW055  BKN070  BKN075
GHG  09/1535  29.94  52  41  66  60   9     10.0  FEW055  BKN065  BKN075
GHG  09/1515  29.94  52  39  62  60  11     10.0  FEW055  BKN065  OVC110
GHG  09/1455  29.94  54  39  58  50   7  13 10.0  SCT055  BKN065  BKN090
GHG  09/1435  29.92  59  36  41 260   9  19 10.0  FEW050  SCT070  SCT095
GHG  09/1415  29.93  59  37  44 270  10  18 10.0  CLR
GHG  09/1355  29.94  59  37  44 260   8  16 10.0  CLR
GHG  09/1335  29.94  57  37  47 250  10  17 10.0  CLR
GHG  09/1315  29.94  54  36  50 260  10  15 10.0  FEW055  SCT070  BKN080
GHG  09/1255  29.94  54  36  50 240   9  16 10.0  FEW060  BKN080
New Bedford
1453Z 8 May 2016 to 1553Z 9 May 2016
STN     TIME PMSL   ALTM   TMP DEW RH  DIR SPD GUS PEAK  VIS  CLOUDS          Weather      MIN MAX P01  PCP
     DD/HHMM hPa    inHg   F   F   %   deg kt  kt  ddfff mile                              F   F   in   in
==== ======= ====== ====== === === === === === === ===== ==== ======= ======= ============ === === ==== ====
EWB  09/1553 1013.5  29.93  64  38  38 250  11  21       10.0  CLR
EWB  09/1453 1013.8  29.94  62  38  41 280  15  23       10.0  FEW095
EWB  09/1353 1014.0  29.95  59  38  45 240   9           10.0  BKN090
EWB  09/1253         29.95  55  39  54 240   9           10.0  BKN100
EWB  09/1153 1014.3  29.95  52  37  57 240   5           10.0  OVC070                       44  52
EWB  09/1053 1013.7  29.94  50  35  56 230   5           10.0  OVC095
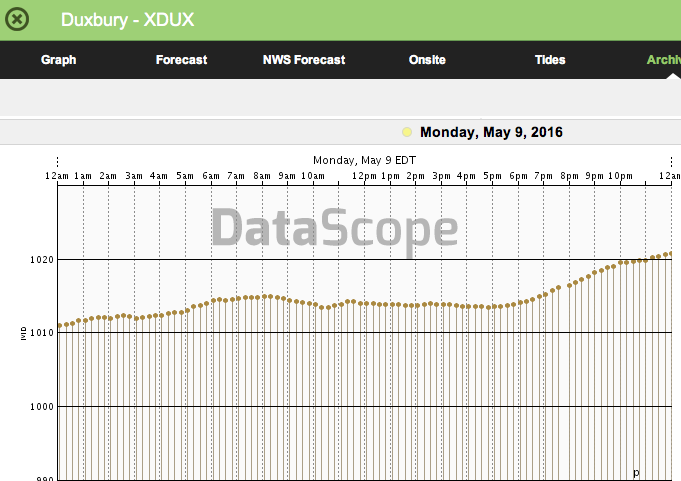
Based on these observations it is not clear that surface pressures were lower in the interior portion of Mass., than they were on the E or S facing shores. We do however, note a simultaneous appearance of overcast conditions or scattered clouds between early morning and 15z, suggesting, that the Shortwave was approaching. There is however no notable signature in the pressure charts:
Minor Sea Breeze front velocity signature on local radar
So what do we think?? It appears that surface pressures were more or less the same at the time of reversal and the only difference is surface temperature, which was nearly 10F between the beaches and the interior. Is this enough to overcome ~20mph of W/SW’rly gradient??? Ideas, thoughts, concerns, talk amongst yourselves….


